A beautiful, interactive sentiment analysis dashboard built with React and Chart.js. Analyze text sentiment in real-time and visualize trends with charts.
This tutorial requires an APIVerve API key. Sign up free - no credit card required.
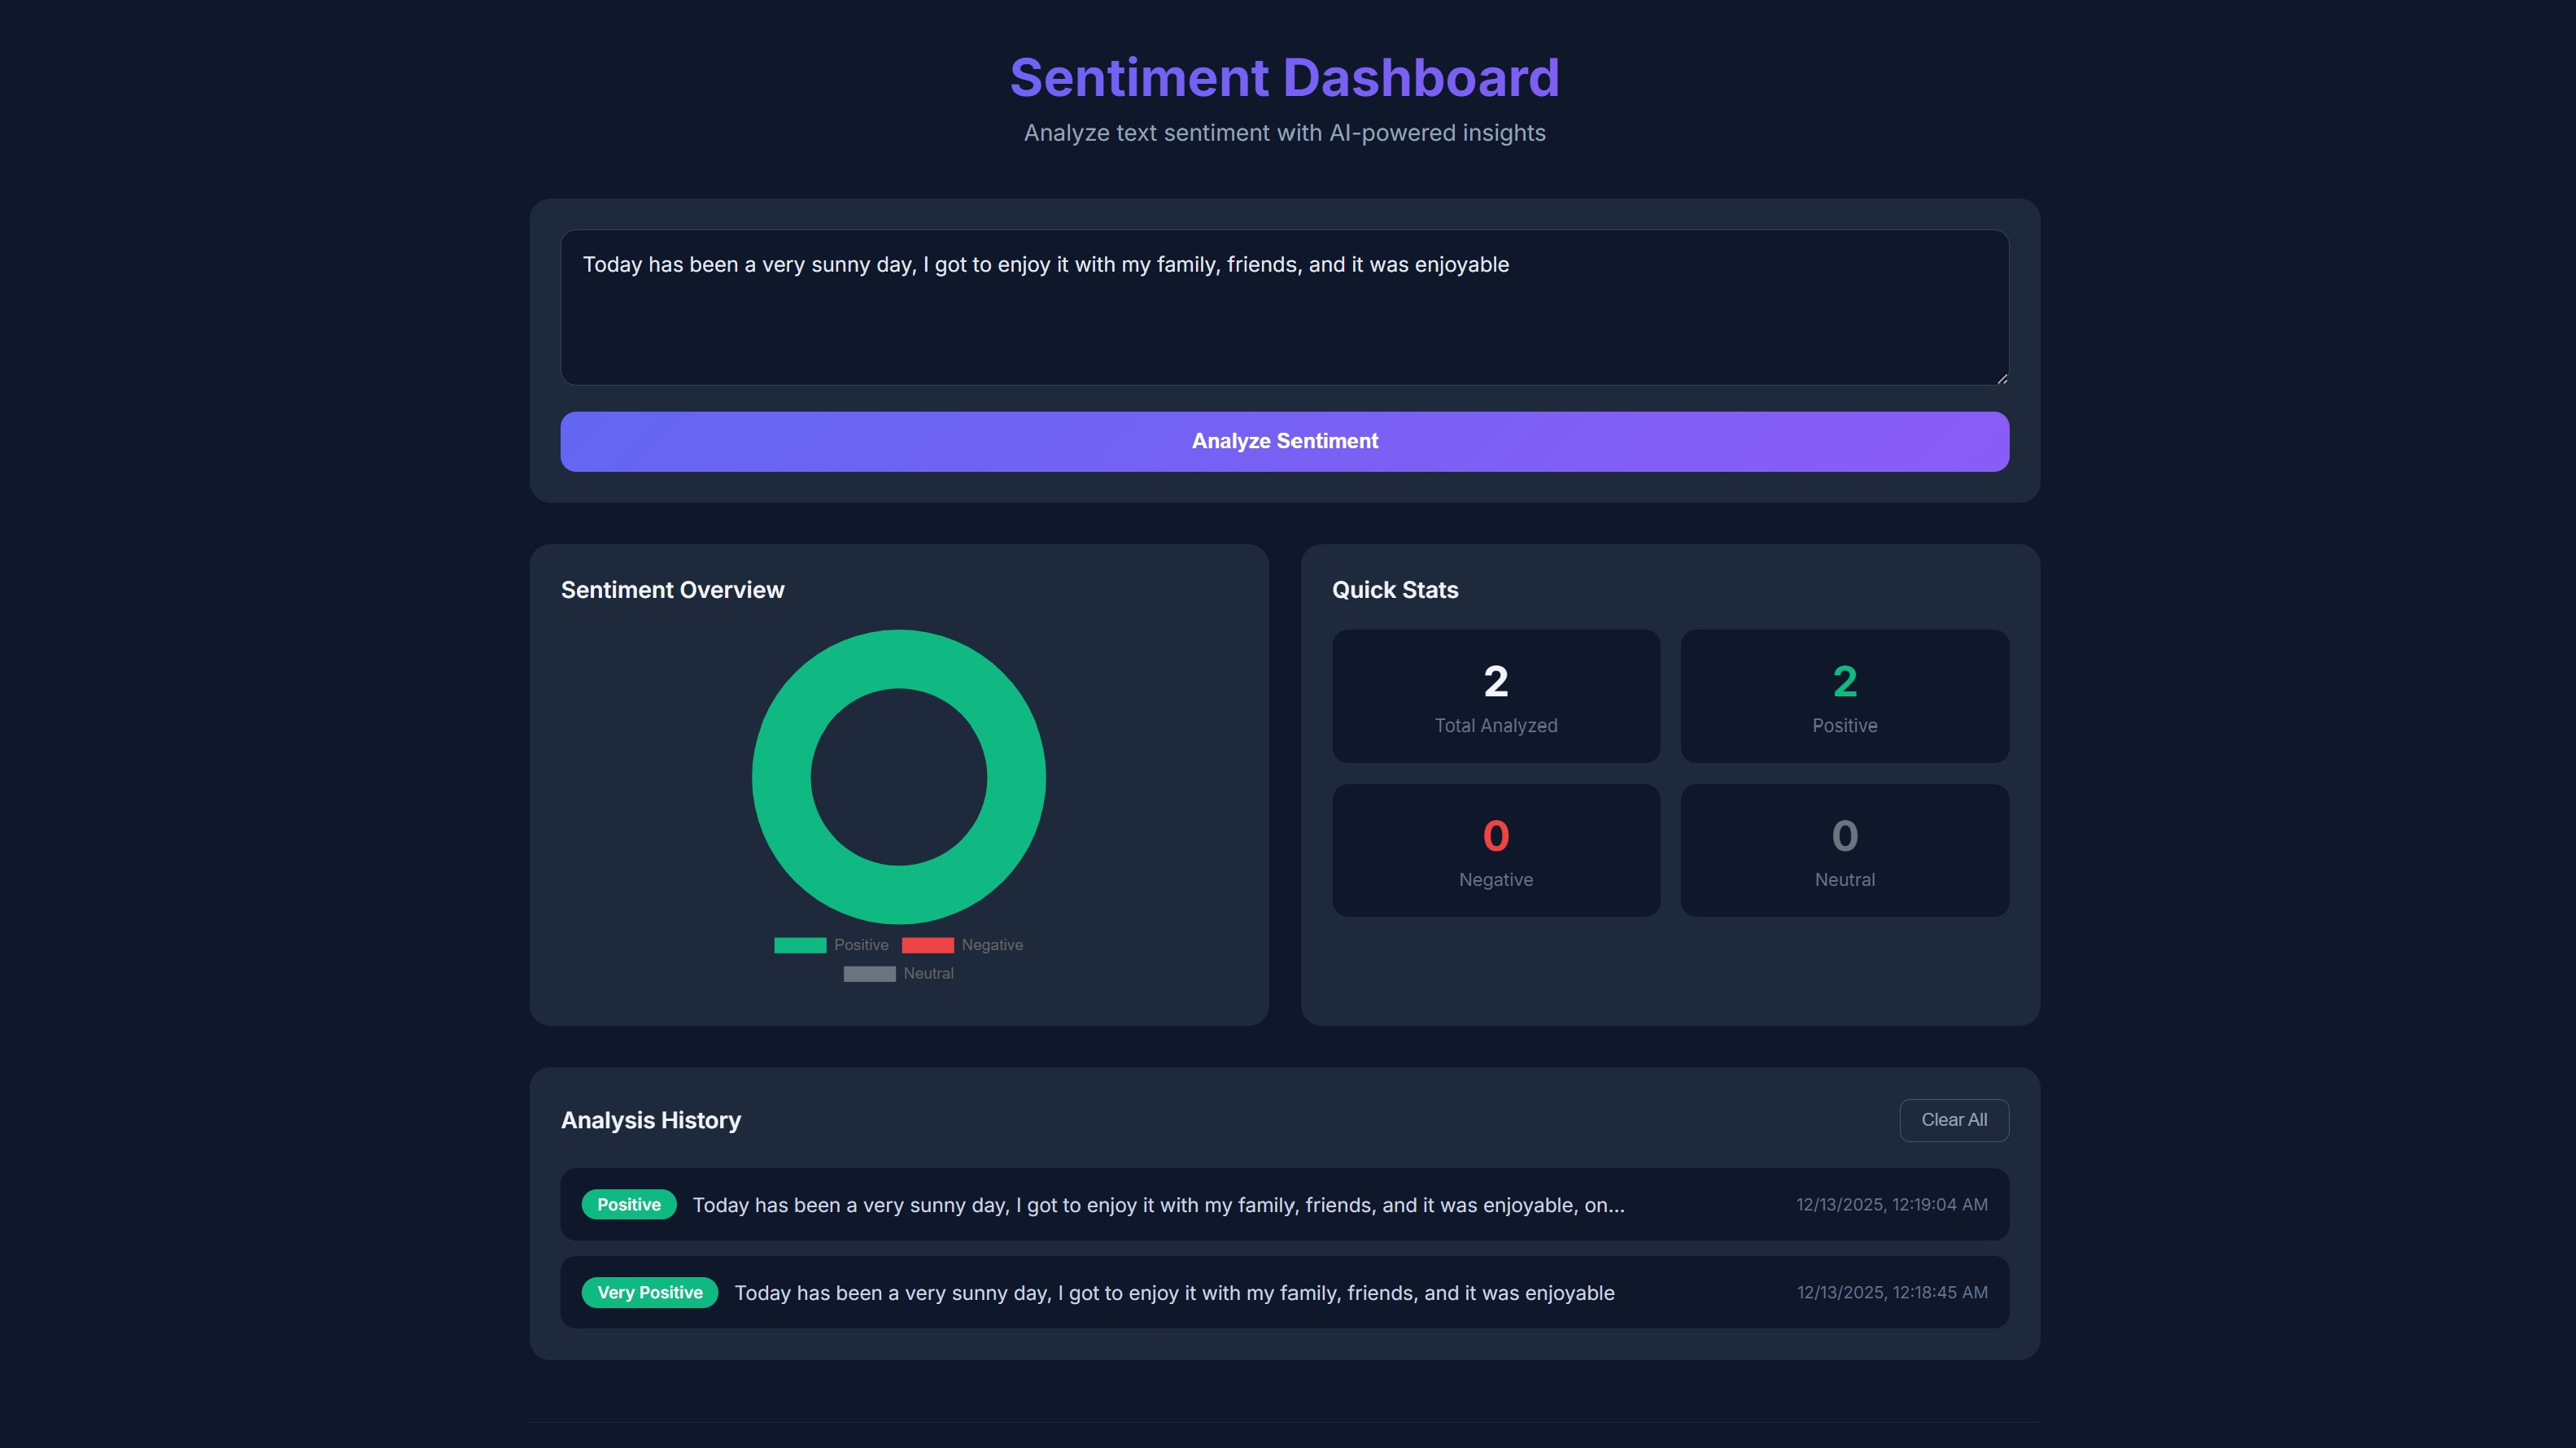
- Real-time sentiment analysis (positive, negative, neutral)
- Interactive doughnut chart visualization
- Analysis history with localStorage persistence
- Quick stats dashboard
- Dark mode UI with modern design
- Copy-to-clipboard functionality
- Responsive layout for all devices
-
Clone this repository
git clone https://github.com/apiverve/sentiment-dashboard-react-tutorial.git cd sentiment-dashboard-react-tutorial -
Install dependencies
npm install
-
Add your API key
Open
.envand add your API key:VITE_API_KEY=your-api-key-here -
Start the development server
npm run dev
-
Open in browser
Navigate to
http://localhost:5173
sentiment-dashboard-react-tutorial/
├── src/
│   ├── App.jsx          # Main component with API logic
│   ├── App.css          # Styling
│   └── main.jsx         # React entry point
├── index.html           # HTML template
├── package.json         # Dependencies
├── vite.config.js       # Vite configuration
├── .env                 # Environment variables (add your API key)
├── screenshot.jpg       # Preview image
├── LICENSE              # MIT license
├── .gitignore           # Git ignore rules
└── README.md            # This file
- User enters text - Type or paste text to analyze
- API request - Sends text to APIVerve Sentiment Analysis
- Response processing - Extracts sentiment and score
- Visualization - Updates chart and stats in real-time
- History storage - Saves results to localStorage
const response = await fetch(API_URL, {
  method: 'POST',
  headers: {
    'Content-Type': 'application/json',
    'x-api-key': API_KEY
  },
  body: JSON.stringify({ text })
});Endpoint: POST https://api.apiverve.com/v1/sentimentanalysis
Headers:
| Header | Value |
|---|---|
Content-Type |
application/json |
x-api-key |
Your API key |
Request Body:
{
  "text": "I love this product! It's amazing."
}
Example Response:
{
  "status": "ok",
  "error": null,
  "data": {
    "sentiment": "positive",
    "sentimentText": "Positive",
    "comparative": 0.625,
    "calculation": [
      { "love": 3 },
      { "amazing": 2 }
    ],
    "tokens": ["i", "love", "this", "product", "its", "amazing"],
    "words": ["love", "amazing"],
    "positive": ["love", "amazing"],
    "negative": []
  }
}Sentiment analysis is powerful for:
- Customer Feedback - Analyze reviews and support tickets
- Social Media Monitoring - Track brand sentiment
- Content Moderation - Detect negative or toxic content
- Market Research - Understand public opinion
- Survey Analysis - Process open-ended responses
- Competitive Analysis - Compare brand perception
- Add sentiment trends over time with line charts
- Export analysis history to CSV
- Add batch analysis for multiple texts
- Integrate with Twitter/X API for live monitoring
- Add word cloud visualization
- Support multiple languages
- React 18 - UI framework
- Vite - Build tool and dev server
- Chart.js - Data visualization
- react-chartjs-2 - React wrapper for Chart.js
Explore more APIs at APIVerve:
- Text Summarizer - Summarize long texts
- Language Detector - Detect text language
- Keyword Extractor - Extract keywords from text
MIT - see LICENSE
- Get API Key - Sign up free
- APIVerve Marketplace - Browse 300+ APIs
- Sentiment Analysis API - API details