modify __eq__ method for Point class, the original == for float is no…#41
Open
jianantian wants to merge 8 commits intoTaipanRex:masterfrom
Open
modify __eq__ method for Point class, the original == for float is no…#41jianantian wants to merge 8 commits intoTaipanRex:masterfrom
jianantian wants to merge 8 commits intoTaipanRex:masterfrom
Conversation
…t robust. add set_epsilon function to change EPSILON value
Owner
|
I know the epsilon approximation for equality is used in papers, I wondering what problem it solves though? If two points differ by less than epsilon, does it matter if Adding a call to |
Contributor
Author
|
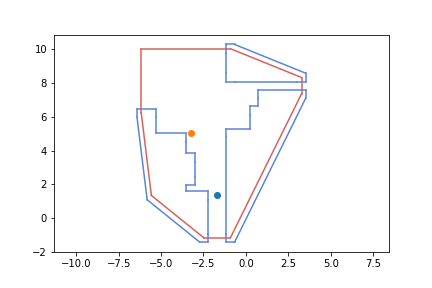
In my example (at end), there is an exception, but as you can see in the graph, no polygon is overlap with other. The debug info is the following: (this is the as you can see, the keypoint is and I think this is caused by the float number precisition. this is my example data, and you can see the graph in the attachment png file.
|
This file contains hidden or bidirectional Unicode text that may be interpreted or compiled differently than what appears below. To review, open the file in an editor that reveals hidden Unicode characters.
Learn more about bidirectional Unicode characters
Sign up for free
to join this conversation on GitHub.
Already have an account?
Sign in to comment
2 participants
Add this suggestion to a batch that can be applied as a single commit.This suggestion is invalid because no changes were made to the code.Suggestions cannot be applied while the pull request is closed.Suggestions cannot be applied while viewing a subset of changes.Only one suggestion per line can be applied in a batch.Add this suggestion to a batch that can be applied as a single commit.Applying suggestions on deleted lines is not supported.You must change the existing code in this line in order to create a valid suggestion.Outdated suggestions cannot be applied.This suggestion has been applied or marked resolved.Suggestions cannot be applied from pending reviews.Suggestions cannot be applied on multi-line comments.Suggestions cannot be applied while the pull request is queued to merge.Suggestion cannot be applied right now. Please check back later.
modify eq method for Point class since the original == for float is not robust.
add set_epsilon function to change EPSILON value.