Visualizing program flow with ShiViz
ShiViz currently specializes in the visualization of distributed system execution logs. It produces concise space-time diagrams that allow users to more easily understand local events as well as interactions between multiple hosts. The generated DAG, however, can be generalized to not only capture the behavior of a distributed system but also the control flow of a program.
With respect to program flow, the visualization could be structured as follows:
- Time still flows from top to bottom
- A vertical line with a box at the top represents a file/class lifeline
- Circles on a file/class lifeline represent entry and exit points for invoked functions
- Lines between these points indicate function calls and returns
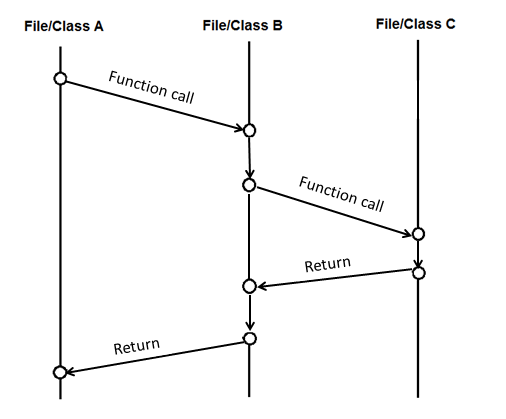
Another approach would be as follows:
- A vertical line with a box at the top represents a function lifeline
- Circles on a function lifeline represent lines in the function as they are executed
- Diagonal lines between lifelines indicate function calls and returns